Projects
Contact
Projects
Contact
Amanda Morgan

Interactive Data Visualization | Spending Explosion

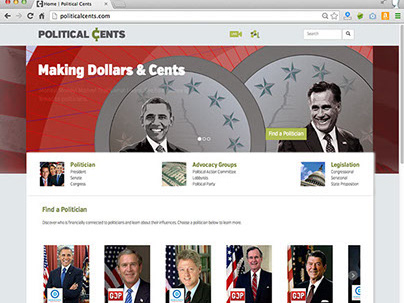
This interactive data visualization details Presidential election spending over 20 years showing an explosive trend.

Spending Explosion: Best Viewed on Desktop in Chrome
 
This interactive data visualization details Presidential campaign spending over 20 years showing explosive trends.

You may also like

Photography | San Francisco
2015
Motion Graphics | Spending Explosion Promotion
2015
Typographic Animation | Hero vs. Villain
2015
Responsive Website Prototype | Political Cents
2015
Photography | Panning & Motion
2015
Photography | Ritzville, Washington
2015
User Experience (UX) | Political Cents Prototype
2015
Logo Design & Specification | Ground Up Media
2015
Motion Graphics | Political Cents Promotion
2015
Web Design | City of Ritzville
2015
↑Back to Top
Amanda Morgan | Portfolio